Value-Strategy Toolkit™ Control Panel
CVI's Value-Strategy Toolkit™ software has value-management tools for assessing your products’ competitive strengths and weaknesses and honing your value proposition. (See Customer Value Analysis for a description of the various data analyses that can be done using the Value-Strategy Toolkit.)
To trigger an analyses, Value-Strategy Toolkit™ users click on sections of the Control Panel (pictured below).
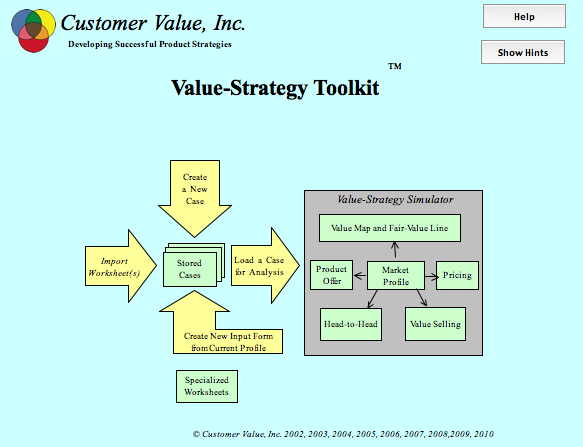
The Control Panel in the Value-Strategy Toolkit™ allows access to the key tools of customer-value analysis.
Yellow boxes
“Input forms”: Data on your market are entered into the Value-Strategy Toolkit™ on an input form. You can define as many market scenarios as you want, each being entered on its own input form. Clicking on this box lets you look at or edit any of your input forms.
“Value Map”: Shows the price-performance plot for all of the competitors in your market. For a description of this and other value analysis tools, see Customer Value Analysis under Managing Customer Value.
“Market Profile”: Takes you to Profile table, which restates the key data currently loaded for analysis by the Value-Strategy Toolkit. You can modify the data here to simulate “what-ifs.”
“Value Scorecard”: Takes you to a table comparing different competitors in terms of the worth to customers associated with their attribute scores.
“Head-to-Head:” Shows you a head-to-head value analysis for the case currently loaded in the Value-Strategy Toolkit. (Look in the Managing Customer Value section for an explanation of this and other analytical displays.)
“Us vs. Them”: Takes you to a page containing head-to-head value comparison charts for your business relative to each of your competitors.
“Pricing:” The Pricing page contains data relevant to setting prices, including an estimate of your product’s fair price based on its attribute strengths and weaknesses relative to competitors.
“Attribute Analysis”: Takes you to page containing various perspectives on the comparative advantages of your product relative to competitors, by attribute
“Who Does What”: Takes you to a page of templates that you can use to plan your implementation strategy.
“Key-Events Time Line”: Lets you plot a time series (for example, monthly sales) with annotations showing the timing of key events.
“Won-Lost Analysis”: Shows you how to analyze customer purchases to derive information about what kinds of deals you are winning and losing.
“User worksheets”: Gives you fast access to Excel worksheets that you have used to store your supplemental data and calculations.
“Suppliers Glossary”: Stores names and abbreviations for commonly encountered competitors
“Snapshots”: Accesses stored images of key analyses that the user has chosen to save
“Radar Chart”: allows you to create a chart that can help you identify your competitors in your served market and define your market.
“Product/Market”: Takes you to a Product/Market matrix, used to help define a served market.
Arrows:
“New Input Form”: lets you specify and create a data form for customer-value data on your market
“Load Profile”: Takes a data set from an input form and structures it for analysis by the Value-Strategy Toolkit
“Import Form”: Copies data from other Value-Strategy Toolkit™ files into the one you’re using.
“Copy Profile to New Input form”: Takes the results of a user defined scenario and stores it as an input form for recall at a later time.
“Make Who Does What”: Allows you to specify and create a new set of tables that will help you document your implementation plans.
“Take Snapshot”: Creates a page with images of key displays of data on the market being analyzed.
“Make Product/Mkt:” Allows you to specify and create a Product/Market table that can be used to help define your served market